


 About SPORTIVO Network
Call Centre KPIs UAE: 12 Metrics Managers Should Track
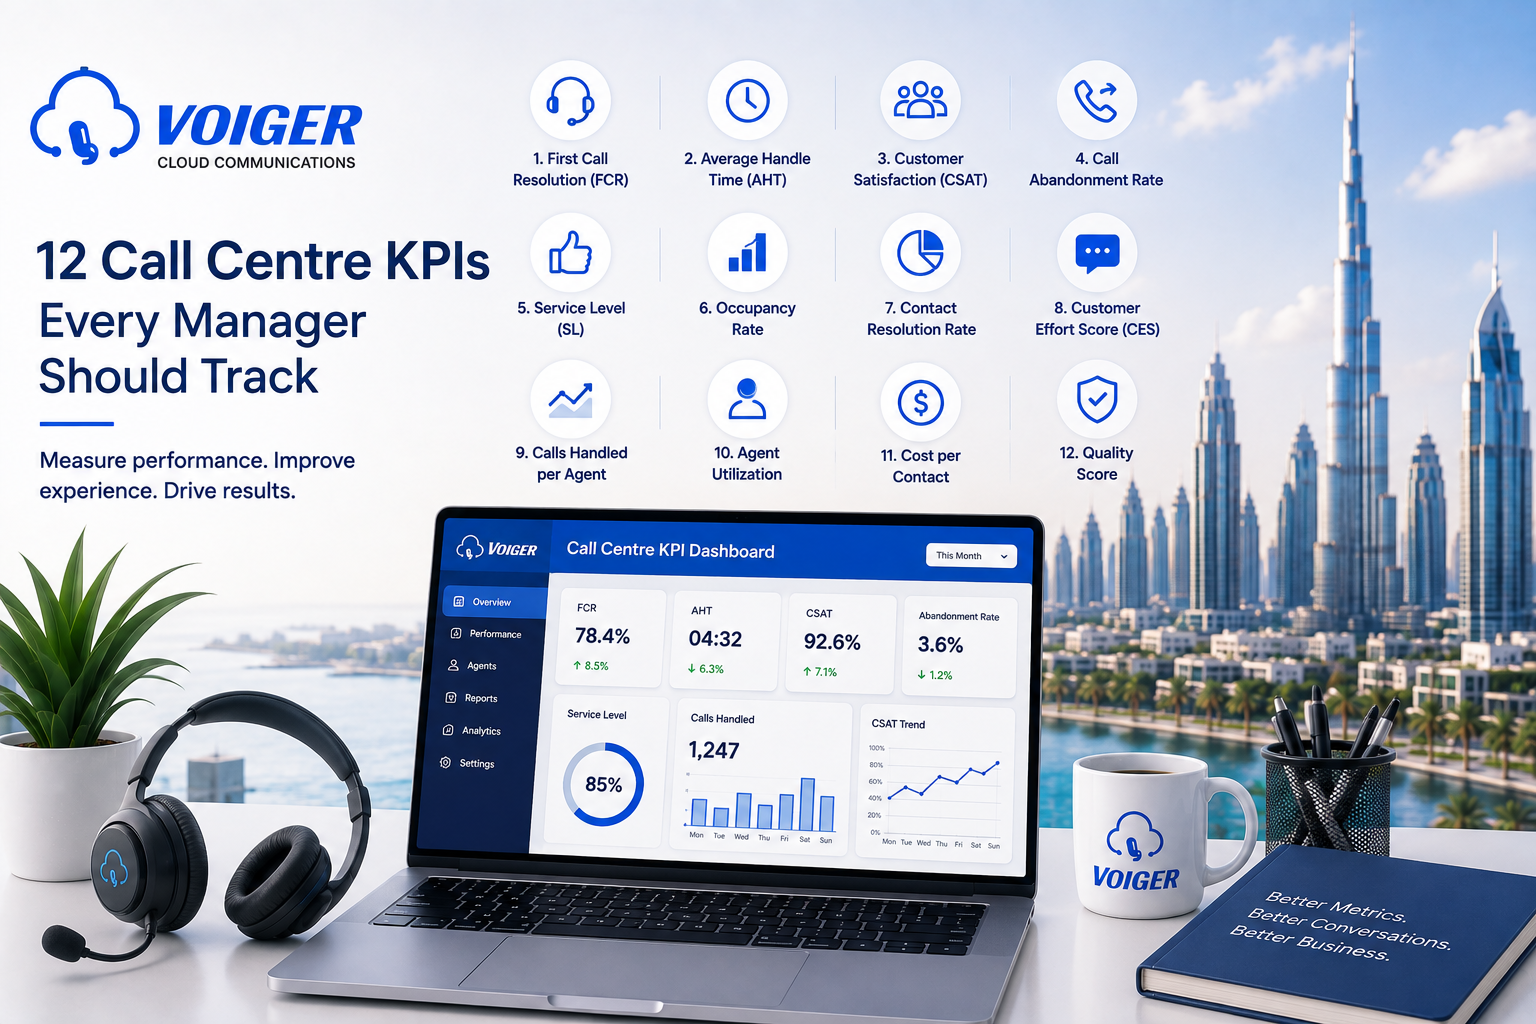
Contact centre managers have access to more data than ever.
But more data does not always create better decisions.
A dashboard may show hundreds of numbers while managers still struggle to answer basic questions:
-
Are we missing customer calls?
-
Are leads being followed up?
-
Are customers reaching the correct team?
-
Are agents resolving problems?
-
Is service quality improving?
-
Which campaigns are creating revenue?
-
Where is the team losing time?
That is why businesses need a focused set of call centre KPIs.
The right metrics help managers understand customer experience, agent productivity, sales performance and operational efficiency.
The wrong metrics can encourage teams to work faster without necessarily working better.
Here are 12 important call centre KPIs UAE sales and support managers should track.
What Is a Call Centre KPI?
A call centre KPI is a measurable indicator used to evaluate the performance of customer communication operations.
KPIs may measure:
-
call demand
-
accessibility
-
response speed
-
service quality
-
agent activity
-
customer outcomes
-
sales conversion
-
operational cost
Contact centre metrics should be selected according to the purpose of the team.
A sales team and customer-support team may share some operational metrics, but their business outcomes are different.
The sales team may prioritise:
-
connection rate
-
qualified opportunities
-
appointments
-
conversion
-
revenue
The support team may prioritise:
-
service level
-
first-contact resolution
-
customer satisfaction
-
repeat calls
-
escalation
Why Call Volume Is Not Enough
A team may place or receive many calls without producing strong outcomes.
High call volume may hide:
-
poor targeting
-
repeated customer contact
-
unresolved issues
-
short, low-quality conversations
-
missed callbacks
-
unnecessary transfers
-
agents rushing customers
-
weak sales conversion
Managers therefore need a balanced view.
A useful dashboard should combine:
-
demand
-
accessibility
-
efficiency
-
quality
-
customer outcome
-
commercial outcome
Current competitor content increasingly separates traditional contact centre metrics from AI-specific measures, reinforcing the need to connect operational data with resolution, experience and business value.
1. Total Call Volume
Total call volume shows the number of inbound and outbound calls handled during a defined period.
It helps managers understand:
-
demand
-
campaign activity
-
peak periods
-
staffing requirements
-
seasonal changes
-
growth patterns
Call volume should be viewed by:
-
day
-
hour
-
queue
-
department
-
campaign
-
agent
-
inbound versus outbound
Volume is a useful starting point, but it does not measure quality or success on its own.
2. Answered Call Rate
Answered call rate shows the percentage of inbound calls answered by the team.
A simple formula is:
Answered calls ÷ total offered calls × 100
A declining answered-call rate may indicate:
-
insufficient staffing
-
poor scheduling
-
long queue times
-
incorrect routing
-
technical issues
-
calls arriving outside operating hours
This metric should be reviewed alongside missed and abandoned calls.
3. Missed Call Rate
Missed call rate shows the percentage of customer calls that were not answered.
For sales teams, every missed call may represent a lost opportunity.
For support teams, missed calls may create repeat contact, complaints or lower satisfaction.
Managers should identify:
-
when calls are being missed
-
which queue is affected
-
whether the caller tried again
-
whether a callback happened
-
how quickly the callback was completed
-
whether after-hours coverage is needed
The objective is not always to eliminate every missed call.
The objective is to ensure missed calls create a clear and measurable follow-up action.
4. Call Abandonment Rate
An abandoned call occurs when the caller disconnects before reaching an agent.
Abandonment may be influenced by:
-
queue time
-
IVR complexity
-
unclear menu options
-
repeated announcements
-
lack of callback options
-
poor routing
-
peak demand
A rising abandonment rate should trigger investigation.
Managers should review abandonment by queue and time period rather than relying only on the overall percentage.
5. Average Speed of Answer
Average speed of answer measures how long customers wait before reaching an agent.
It helps managers understand accessibility and queue performance.
However, the metric should not be viewed in isolation.
A very fast answer followed by poor service is not a good customer outcome.
Average speed of answer should be combined with:
-
resolution
-
satisfaction
-
transfer rate
-
quality
-
abandonment
6. Service Level
Service level measures the percentage of calls answered within a defined time threshold.
For example, a business may choose to measure the percentage of calls answered within 20 or 30 seconds.
The correct threshold depends on:
-
industry
-
customer expectations
-
team size
-
urgency
-
call type
-
operating model
Managers should set realistic service targets for different queues.
A sales enquiry queue may need a different target from a general information line.
7. Average Handle Time
Average handle time generally includes:
-
talk time
-
hold time
-
after-call work
It helps managers understand how long the team spends completing an interaction.
A higher handle time may indicate:
-
complex enquiries
-
insufficient agent knowledge
-
slow systems
-
excessive manual work
-
poor routing
-
long after-call notes
A lower handle time is not automatically better.
If agents are ending calls quickly without resolving the issue, the metric can create the wrong behaviour.
The aim should be efficient resolution, not simply shorter calls.
8. First-Contact Resolution
First-contact resolution measures whether the customer’s issue is resolved during the initial interaction without requiring repeat contact.
It is particularly important for support operations.
A low first-contact resolution rate may indicate:
-
weak agent knowledge
-
limited authority
-
poor routing
-
disconnected systems
-
incomplete customer information
-
unnecessary escalation
-
lack of integration
Businesses should define clearly what counts as resolved.
The metric becomes unreliable when agents or teams use different definitions.
9. Transfer Rate
Transfer rate shows how often calls are transferred from one agent, queue or department to another.
Transfers are sometimes necessary.
But a high transfer rate may indicate:
-
confusing IVR design
-
incorrect routing
-
unclear team ownership
-
insufficient agent permissions
-
customers choosing the wrong option
-
lack of customer context
Managers should examine whether transferred calls are reaching the right destination and whether customers need to repeat information.
10. Agent Occupancy and Availability
Agent occupancy measures how much logged-in time is spent handling calls and after-call activity.
Availability shows whether agents are ready to receive interactions.
These metrics help with:
-
workload planning
-
scheduling
-
queue management
-
identifying underutilisation
-
identifying overload
-
remote-team management
Very low occupancy may indicate excess capacity or low demand.
Very high occupancy over long periods may create fatigue and reduce service quality.
Managers should look for sustainable performance rather than maximum utilisation every minute.
11. Quality Score
A quality score evaluates how effectively an agent handled the conversation.
A scorecard may include:
-
correct greeting
-
caller verification
-
listening
-
accurate information
-
professionalism
-
empathy
-
process compliance
-
issue resolution
-
call closing
-
note quality
Traditional quality programmes often review only a sample of calls.
AI-assisted transcription, summaries, tags and scorecards can help managers review a broader set of conversations, but automated results should still be interpreted carefully.
Quality scoring should be used for coaching and improvement, not only for ranking employees.
Voiger’s platform positioning includes call summaries, sentiment insights, supervisor tools, dashboards and sales and support analytics within the broader cloud contact centre environment.
12. Sales Conversion or Resolution Outcome
Every contact centre should connect activity to its final business outcome.
For sales teams, this may include:
-
leads qualified
-
appointments booked
-
demonstrations scheduled
-
proposals created
-
deals won
-
revenue generated
-
MRR generated
For support teams, this may include:
-
issues resolved
-
repeat contact avoided
-
escalation completed
-
satisfaction outcome
-
retention
-
complaint closure
This is one of the most important principles in contact centre reporting:
Activity metrics show what the team did. Outcome metrics show whether it mattered.
Additional KPI: Callback Completion
Callback completion deserves special attention for businesses that receive high volumes of enquiries.
Managers should track:
-
callbacks promised
-
callbacks completed
-
average callback time
-
overdue callbacks
-
conversion from callback
-
callback owner
A missed call followed by a prompt callback may still become a successful customer interaction.
A missed call with no follow-up is a lost opportunity.
Additional KPI: Customer Sentiment
Sentiment analysis can help identify whether a conversation was:
-
positive
-
neutral
-
negative
-
improving
-
deteriorating
It may help managers identify:
-
frustrated customers
-
difficult call types
-
coaching opportunities
-
recurring service problems
-
escalation risk
Sentiment should be treated as a signal, not an unquestionable verdict.
Language, tone, sarcasm, background noise and cultural expression can affect automated interpretation.
Sales KPIs and Support KPIs Should Not Be Identical
A common reporting mistake is using one scorecard for every team.
Sales Team KPIs
A sales dashboard may prioritise:
-
outbound attempts
-
connection rate
-
qualified conversations
-
callbacks completed
-
appointments
-
demonstrations
-
proposals
-
conversion
-
new revenue
Support Team KPIs
A support dashboard may prioritise:
-
answered-call rate
-
service level
-
abandonment
-
first-contact resolution
-
transfer rate
-
repeat contact
-
quality
-
satisfaction
Shared metrics are useful, but each team needs outcomes aligned with its role.
How Often Should KPIs Be Reviewed?
Real-Time
Monitor:
-
queue volume
-
waiting callers
-
agent availability
-
service level
-
missed calls
-
abnormal technical conditions
Daily
Review:
-
total volume
-
answered and missed calls
-
callbacks
-
agent activity
-
campaign progress
-
urgent escalations
Weekly
Review:
-
trends
-
quality
-
sales conversion
-
first-contact resolution
-
staffing
-
coaching needs
-
recurring customer issues
Monthly
Review:
-
business outcomes
-
customer trends
-
revenue impact
-
cost
-
team performance
-
workflow improvements
-
technology changes
Real-time data supports intervention.
Weekly and monthly data supports management decisions.
How Many KPIs Should a Dashboard Show?
A dashboard should not display every available metric equally.
Managers should identify approximately:
-
five core operational KPIs
-
three customer or quality KPIs
-
three business-outcome KPIs
Supporting data can remain available for deeper analysis.
The main dashboard should answer:
-
What is happening now?
-
Where is the risk?
-
Which team needs support?
-
Are customers being helped?
-
Are we creating business value?
Common KPI Mistakes
Measuring Only Agent Activity
More calls do not always mean better results.
Comparing Different Queues Directly
A technical-support queue and sales-enquiry queue may have completely different call patterns.
Rewarding Short Calls Without Measuring Resolution
This can encourage agents to rush customers.
Ignoring Missed-Call Follow-Up
A missed call can still be recovered through disciplined callbacks.
Using Quality Scores Only for Punishment
Quality should guide coaching and process improvement.
Tracking Data Without Acting
A dashboard has little value if problems remain unresolved.
Questions to Ask When Choosing Contact Centre Reporting Software
-
Can managers see live queue activity?
-
Can reports be separated by team, queue, campaign and agent?
-
Can missed calls and callbacks be tracked?
-
Are sales and support outcomes configurable?
-
Can reports connect with CRM data?
-
Can calls be reviewed with recordings or transcripts?
-
Are summaries, tags and scorecards available?
-
Can managers export or schedule reports?
-
Can the platform show historical trends?
-
Can role-based access limit sensitive information?
-
Can custom dashboards be created?
-
Can reports be used across office, remote and hybrid teams?
The Bottom Line
The best call centre KPIs UAE businesses track are not always the most complicated.
Managers need a balanced view of:
-
demand
-
accessibility
-
speed
-
efficiency
-
quality
-
customer outcome
-
commercial result
Call volume tells only part of the story.
The real objective is to understand whether customers are being answered, helped and moved towards the right outcome.
A good dashboard should make that visible.
Ready to Improve Contact Centre Visibility?
Voiger helps sales and support managers monitor call activity, queues, agent availability, performance, recordings and customer-conversation insights through one cloud contact centre platform.
Book a demonstration to explore how Voiger can help your team turn call data into clearer operational decisions.
FAQs
What are call centre KPIs?
Call centre KPIs are measurable indicators used to assess call demand, accessibility, team productivity, service quality and customer outcomes.
Which call centre KPI is most important?
There is no single KPI for every team. Sales teams may prioritise conversion, while support teams may prioritise first-contact resolution and satisfaction.
What is average speed of answer?
Average speed of answer measures how long callers wait before reaching an agent.
What is first-contact resolution?
First-contact resolution measures whether the customer’s issue was resolved during the initial interaction without requiring repeat contact.
Is lower average handle time always better?
No. Very short calls may indicate that agents are rushing customers or failing to resolve enquiries.
What should a sales call centre dashboard include?
It should include attempts, connections, qualified conversations, callbacks, appointments, proposals, conversions and revenue outcomes.
What should a customer-support dashboard include?
It should include answered calls, service level, abandonment, resolution, transfers, quality and repeat contact.
Can AI help with contact centre reporting?
AI can assist with transcription, summaries, sentiment, tagging and quality scorecards. Managers should still review important findings and use them as part of a broader performance process.

 Czech
Czech
 English
 Arabic
 French
 Spanish
 Deutsch
 Turkish
 Dutch
Dutch
 Italiano
 Russian
 Romaian
 Portuguese (Brazil)
 Greek
Greek